
Hospital Microbiome Project

University of Chicago’s new Center for Care and Discovery
In 2012, we began working on a new project at the University of Chicago’s new hospital facility: the Center for Care and Discovery. The Hospital Microbiome Project was designed to collect microbial samples from surfaces, air, staff, and patients from the University of Chicago’s new hospital pavilion in order to better understand the factors that influence bacterial population development in healthcare environments. Of particular importance and interest are the microbes and viruses that may influence the spread of hospital acquired infections.
We were involved on this project as a subcontract to the University of Chicago to collect data for a number of building environmental and operational parameters — collectively called “building science measurements” or “built environment data” that may influence microbial communities in the hospital. The PI on the project is Dr. Jack Gilbert, who is dually appointed in the Department of Ecology & Evolution at U of C and as an Environmental Microbiologist at Argonne National Laboratory. His group specializes in advanced DNA sequencing techniques for identifying microbial communities and he and his team utilize these techniques all over the world. Our team, in conjunction with Dr. Jeff Siegel at the University of Toronto, worked to measure a variety of indoor environmental conditions, human occupancy, and operational characteristics in several patient rooms that we hope ultimately will help explain some of the differences in microbial communities that are observed by Jack’s team over the course of a year. Measurements included environmental conditions (indoor dry-bulb temperature, relative humidity, humidity ratio, and illuminance) in the patient rooms and nurse stations; differential pressure between the patient rooms and hallways; surrogate measures for human occupancy and activity in the patient rooms using both indoor air CO2 concentrations and infrared doorway beam-break counters; and outdoor air fractions in the heating, ventilating, and air-conditioning systems serving the sampled spaces. We also utilized passive sampling of airborne microbes using a thin sheet of HVAC filter media installed over the return grilles in the rooms.

Hospital room layouts with building science sensor and microbial sampling sites
The data began pouring in February of 2013 and we finished collection in mid-January of 2014. Environmental engineering master’s student Tiffanie Ramos (also a Starr Fieldhouse Fellowship winner at IIT) made (and later coordinated) weekly visits to the hospital to gather data and perform general sensor maintenance. At the end of the yearlong monitoring period we ended up with approximately 100,000 time-series building science data points associated with about 80 different variables throughout the hospital and patient rooms for a total of over 8 million data points!
Our findings include the following:
- Indoor temperature, illuminance, and human occupancy/activity were all weakly correlated between rooms
- Relative humidity, humidity ratio, and outdoor air fractions showed strong temporal (seasonal) patterns and strong spatial correlations between rooms
- Differential pressure measurements confirmed that all patient rooms were operated at neutral pressure
- The patient rooms averaged about 100 combined entrances and exits per day, which suggests they were relatively lightly occupied compared to higher traffic environments (e.g., retail buildings) and more similar to lower traffic office environments
- There were also clear differences in several environmental parameters before and after the hospital was occupied with patients and staff
Full details and results are provided in an upcoming publication in PLoS ONE. Below you will find a heat map figure showing weekly averages of environmental conditions in the patient rooms and nurse stations measured over the duration of the project.
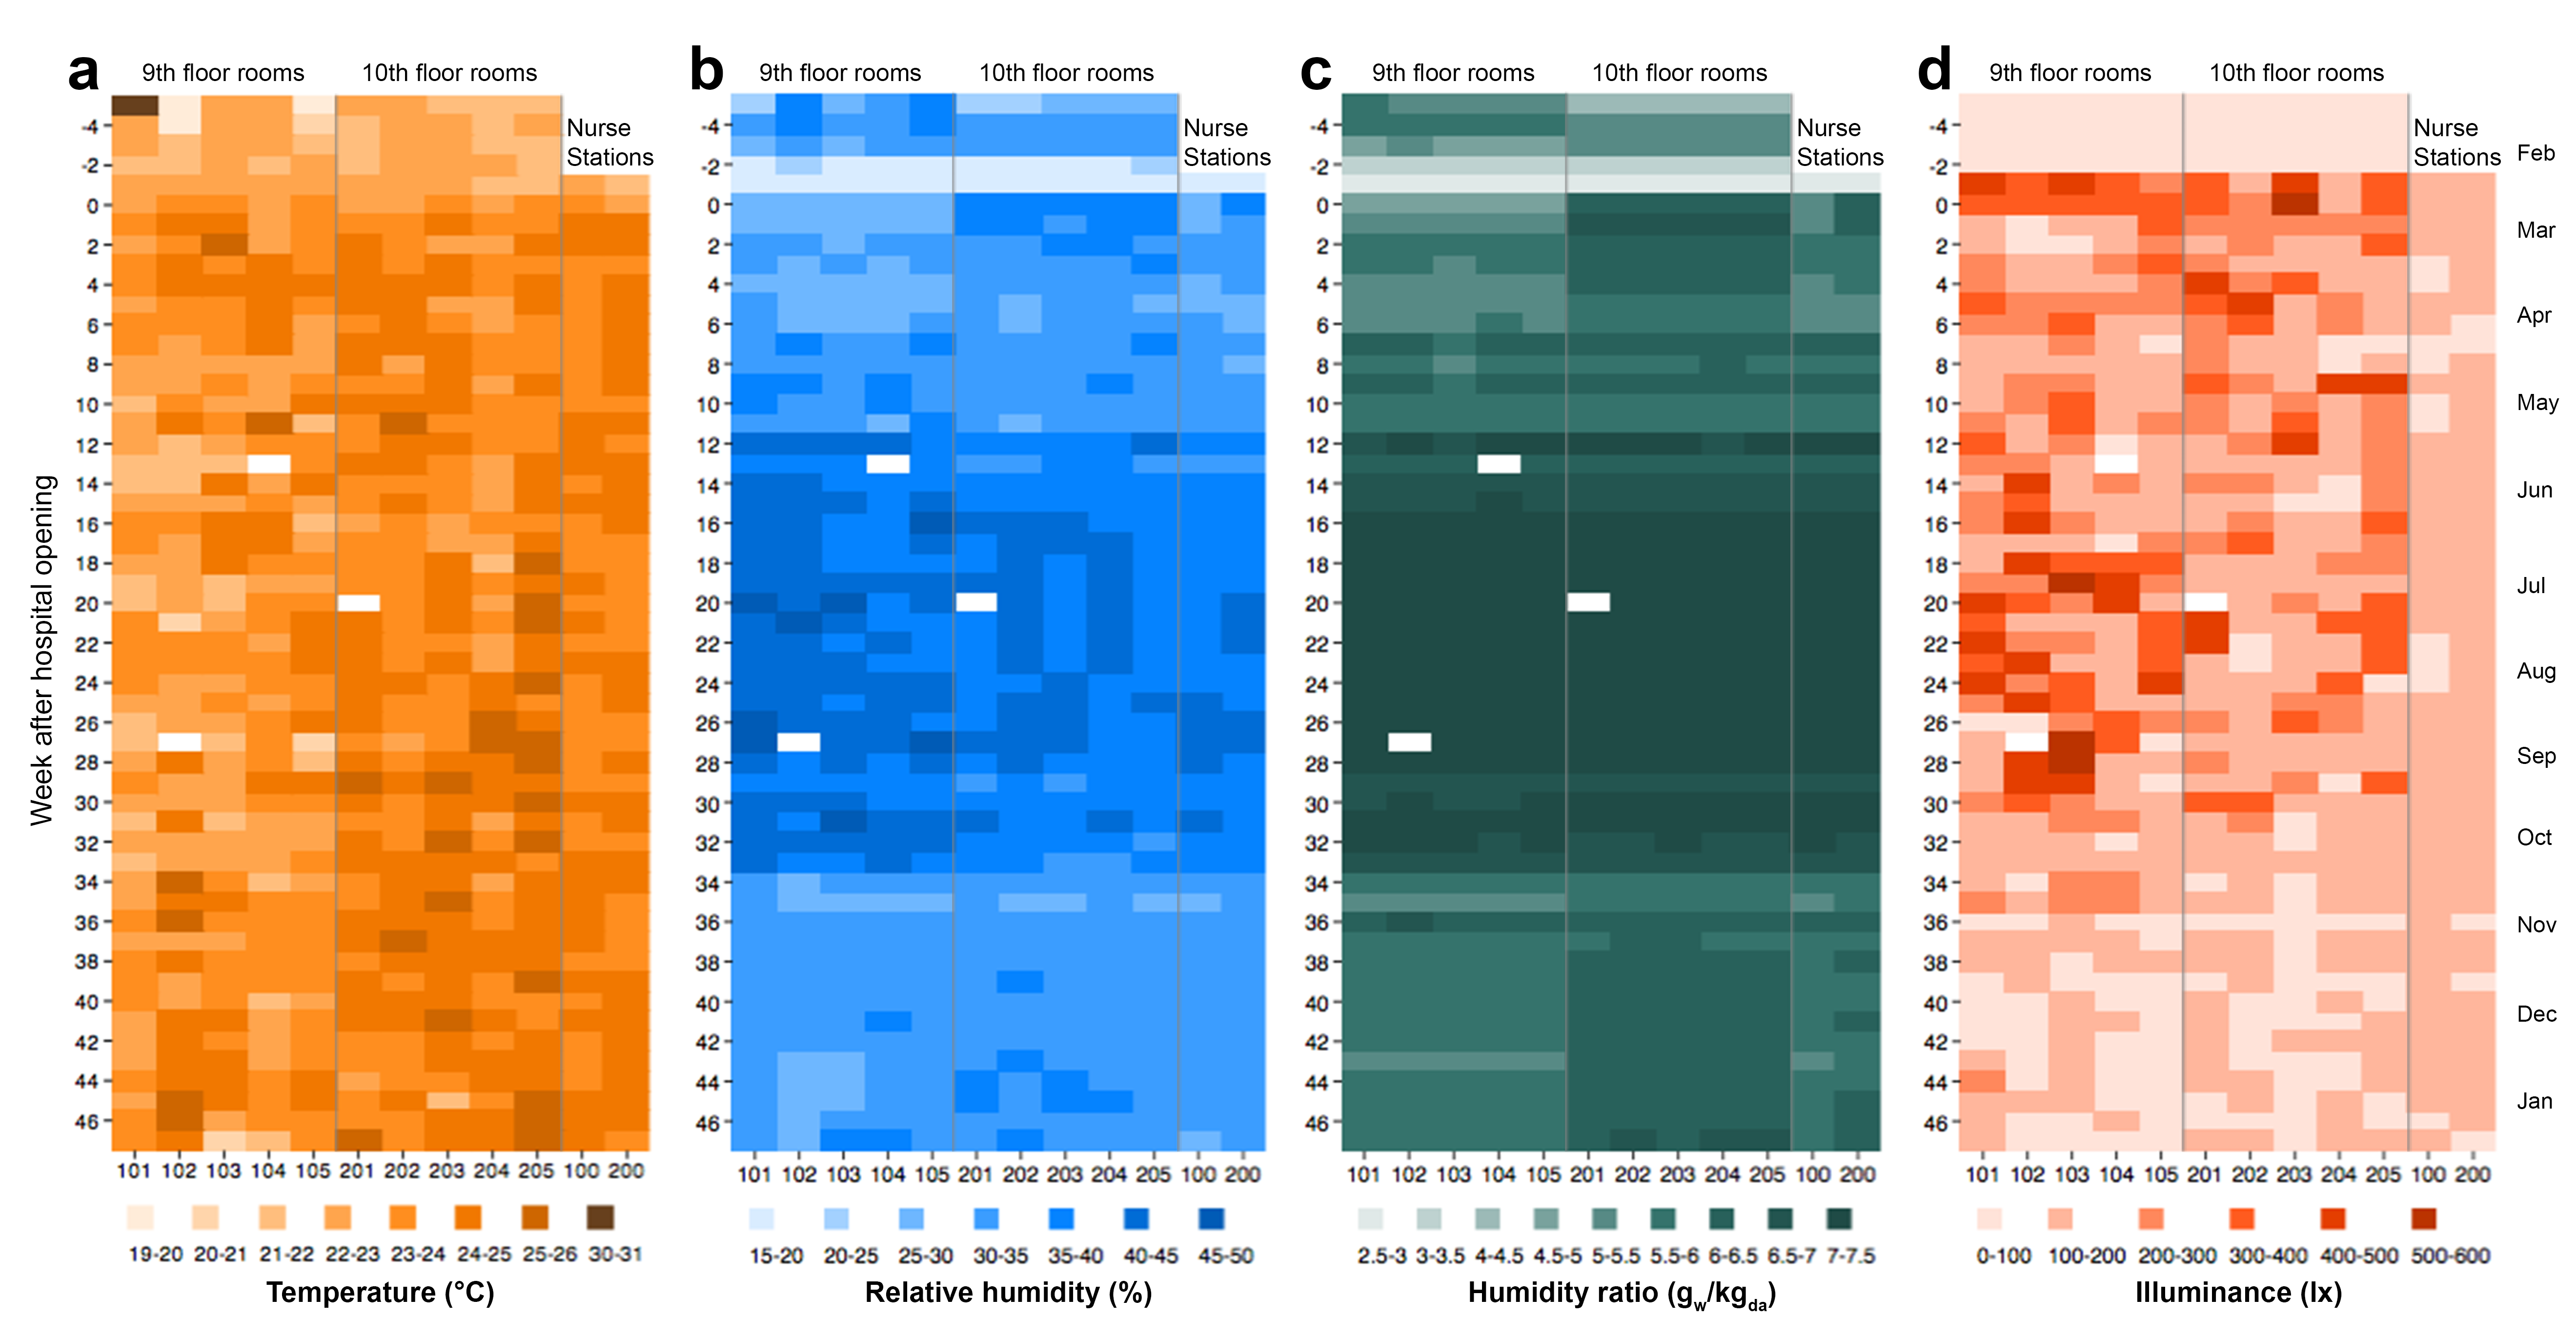
Weekly averages of environmental conditions in the patient rooms and nurse stations measured over the duration of the project.: (a) temperature, (b) relative humidity, (c) humidity ratio, and (d) illuminance. Rooms 101-105 are on the 9th floor; rooms 201-205 are on the 10th floor. Room 100 and 200 are the nurse station locations on the 9th and 10th floor, respectively. Weeks are counted from the week of hospital opening (i.e., week 0). White areas represent missing values. Values along the x-axes correspond to room identification numbers.
This unique dataset characterizes the dynamics of indoor environmental conditions, human occupancy, and operational characteristics of a critical building during a unique period of time (from pre-occupancy to occupancy), and the findings are important because these parameters have a major influence on human comfort and indoor environmental quality, including the survival and progression of microbial communities. Stay tuned to outcomes from the microbial sequencing work being done in succession with our analysis.
Links
Read a recent blog post on microBE.net about this work.
Related publication(s): meeting report in Standards in Genomic Sciences
Popular news coverage of the Hospital Microbiome Project:
- Chicago Tribune – January 2013
- Nature News – May 2013
- PBS NOVA Next – April 2014
Acknowledgements
This project is funded by the Alfred P. Sloan Foundation. We are grateful to Jack Gilbert’s team, including Dan Smith at Argonne Lab, as well as Jeffrey Siegel at the University of Toronto, who is working with us on the building science measurements.
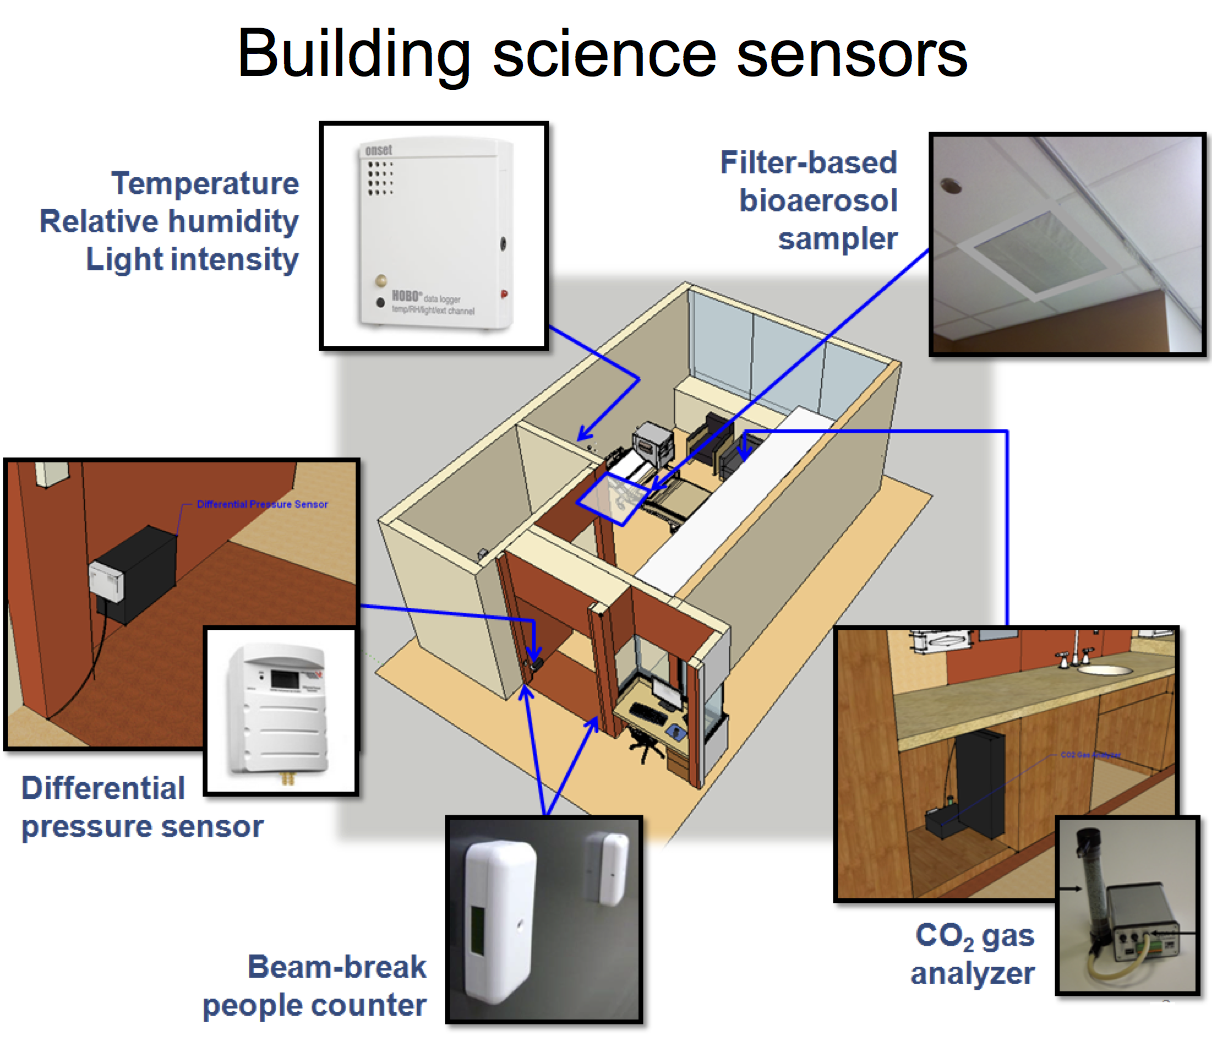
Summary of sensors used in the patient rooms