
Analyzing a database of over 6 million online sales of residential HVAC filters from 2008 to 2017
By Brent Stephens on March 1, 2019
Back in May 2018 I was invited to give a talk about our research on mass-based HVAC particle filtration metrics at the National Air Filtration Association’s (NAFA) annual Tech Seminar, and I made a pitch to the audience of mostly filter manufacturers and retailers that the academic community needs more information on the residential air filtration market. Basically: how can we estimate what fraction of the U.S. population uses what kinds of filters? I’ve tried to get at this question before. In a 2014 paper in which we needed some statistics on the national distribution of filter ownership, we really had to make some back of the envelope estimates from a variety of fairly low quality sources (including some personal communication with a colleague in the industry who gave us the thumbs up on our estimates, saying “that sounds about right”).
Fortunately, one of the audience members at my NAFA Tech Seminar presentation, Rich Scott from Discount Filters, a major online retailer of HVAC filters, volunteered to provide me some sales data. Rich and his team provided me a database of over 6 million filters they have sold to (mostly) residential customers from 2008 to 2017. I say “mostly” because they sorted the data by commercial vs. residential address, although they know that not to be the most accurate description of their customers, but sufficient enough for this purpose. There are a few other caveats worth noting about their data as well, including: 1) the sample is large, but might not represent the entire U.S. residential marketplace (e.g., online consumers might differ from in-store consumers; some of their customers are large management organizations that buy lots of filters, which can dwarf individual consumers); 2) they don’t sell every type of filter under the sun, so the data are obviously skewed to the products they sell (e.g., they only sell MERV filters and not other metrics like FPR or MPR; these are mostly 1-inch filters and deeper-bed 4- and 5-inch filters combined into one data set, I don’t think there are any 2″ filters here); and 3) some of the trends over time capture more than just changes in sales due to consumer preference alone (e.g. changes are also affected by the marketing efforts and product offerings of this particular retailer, which have also changed over time). Nevertheless, let’s look at the data! Many thanks to Rich Scott and Tyler Dishman at Discount Filters for providing these data and being so willing to share the data publicly.
First, let’s look at the data set of sales over time. Their sales grew from ~180,000 filters in 2008 to ~1.3 million filters in 2017. The total number of filters in the data set is about 6.4 million from 2008 to 2017.
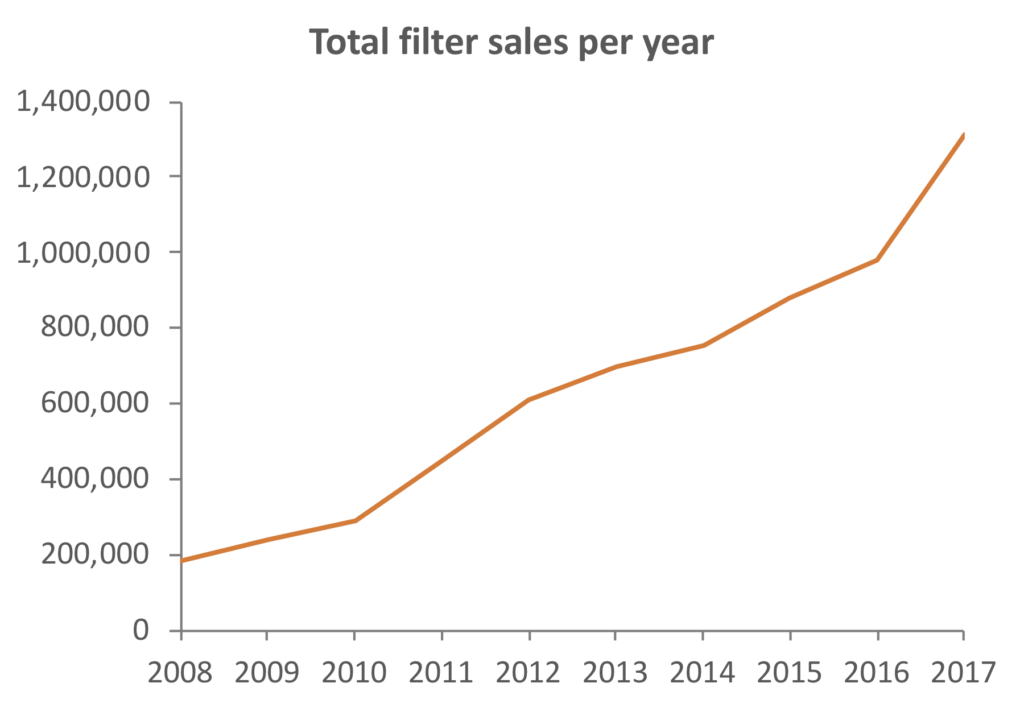
Total number of (mostly) residential filters sold by discountfilters.com from 2008 to 2017
That’s a lot of filters! Next, let’s look at the trends of fraction of total sales of the different filter types that this retailer sells over the same time period.
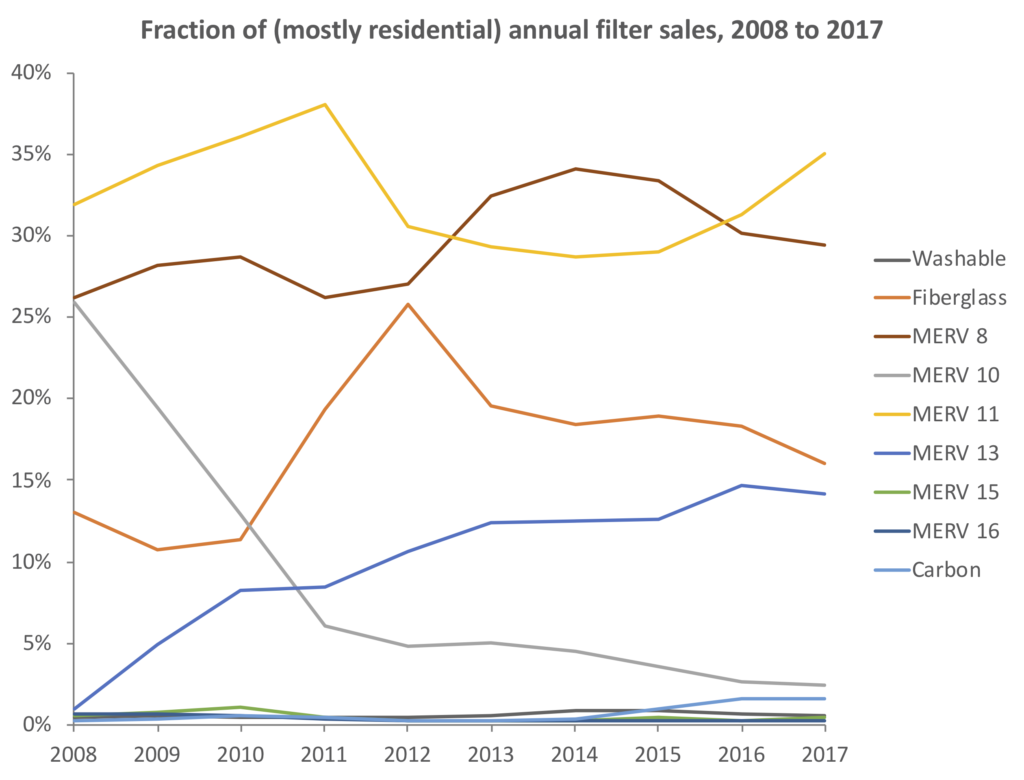
Fraction of different types of (mostly) residential filters sold by discountfilters.com from 2008 to 2017
You can see MERV 13 steadily on the rise since 2008, while the fraction of MERV 8, 11, and fiberglass (i.e. low MERV, probably less than MERV 4) filters are all fairly steady over time, albeit with some year to year variation. MERV 10 filters have been decreasing but the retailer mentioned to me that has less to do with the filters themselves and more to do with production and marketing (in other words, the retailer has moved away from MERV 10 in favor of some of the other filters). Washable, MERV 16, and activated carbon filter sales were steadily low throughout the period.
Last, let’s look at a snapshot of these same data in 2017, the most recent full year of sales in the data set.
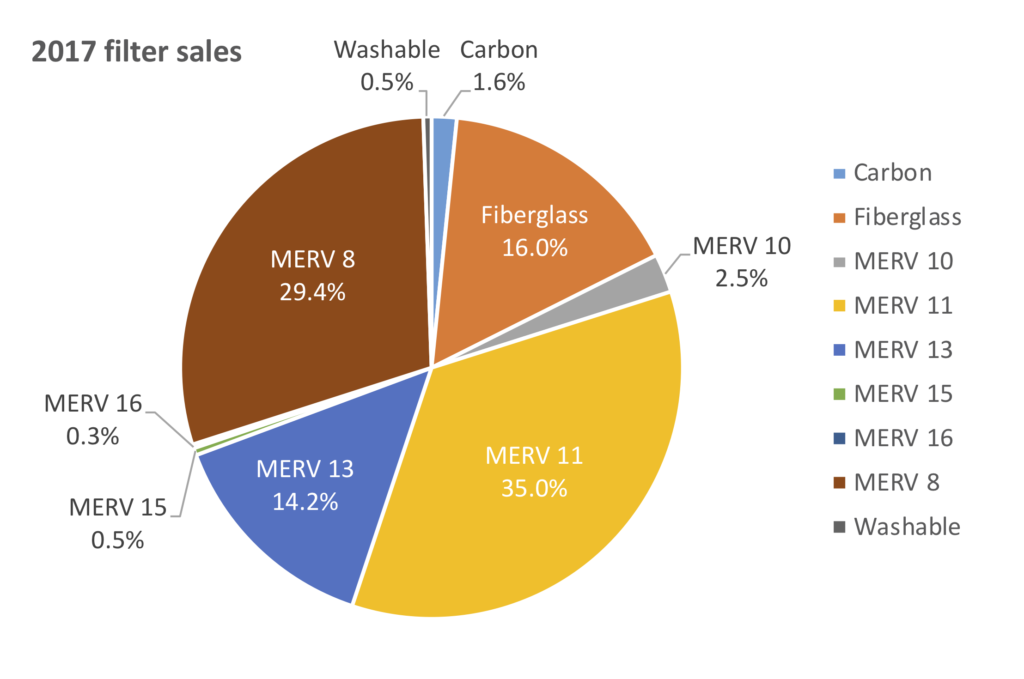
Fraction of different types of (mostly) residential filters sold by discountfilters.com in 2017
In 2017, for this particular retailer, MERV 11 filters made up the largest share of sales at about 35%, followed by MERV 8 at about 29% of sales. Fiberglass filters were third at around 16% followed by MERV 13 filters at about 14% of sales. In fact, fewer than 15% of filters sold were MERV 13 or higher. These data suggest that at least for shoppers on this major online retail site, not that many people are using high efficiency filters in U.S. residences! I hope you find these data helpful.